The MQ135 is a cheap air quality sensor used for measure of different gases, like alcohol, carbon monoxide and carbon dioxide, after doing some research and using the info provided by Davide Gironi, the way to measure ppm of gases according datasheet is this:

Then we need the slope from each function, for that, we can measure the start and end points digitally with a
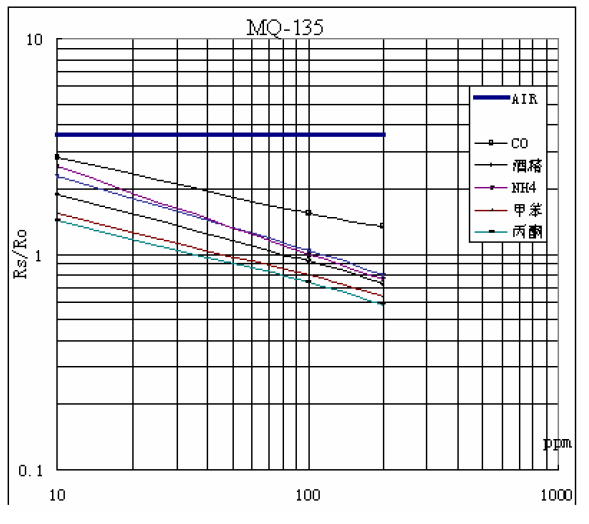
very util tool: WebPlotDigitizer http://arohatgi.info/WebPlotDigitizer/app/, only download the log graphic above, upload to WPD tell to it where x and y axes starts-end and putting log scale in the checkbox..
The values obtained by me are:
- AIR (10, 3.58),(200, 3.58)
- CO (10, 2.8351) ,(200,1.3464)
- CO2 (10, 2.3),(200,0.8)
- ETHANOL (10, 1.90),(200,0.73)
- NH4 (10,2.55),(200,0.765)
- TOLUENE (10, 1.54),(200, 0.64)
- ACETONE (10, 1.44), (200,0.583)

back to the calculus, the first formula to calculate the slope is m=(y2-y1)/(x2-x1) but we are in log scale then the formula with logarithmic laws comes from m = (log y2 - log y1) / (logx2 - logx1) to m = log (y2/y1) / log (x2/x1) then we need this formula:

- CO2 (10, 2.3),(200,0.8)
x1 = 10
x2 = 200
y1 = 2.3
y2 = 0.8
m = log(0.8/2.3) / log(200/10) = -0.4586/1.3010 = -0.3525
and the function is y = [2.3/10^(-0.3525)] * x ^ (-0.3525) = 5.0152 * x ^(-0.3525)
y is our final function buuut, respect to x, we need respect to y , because y is (rs/ro) and we need x(ppm)
clearing the equation (I'd recomend wolfram) the final function is...
voila! the aproximate form an final formula is
x = 96.9691 * y^(-2.83688) or ppm = 96.9691 * (rs/ro)^-2.83688
comparing with the Davide Gironi equation, the scale factor is different
ppm = 116.6020682 (Rs/Ro)^-2.769034857
all depends of measured slope
I measured the points manually on the plot with WPD, and I compared them with my calculated function (with matlab and plotly) and this is the result:
 | |
| Plotly link https://plot.ly/~zesters/0/co2-real-co2-equation-co-real-co-equation-ethanol-real-ethanol-equation-nh4-real/ |

Where blue is the real graphic from datasheet and orange is the equation. The conclusion is: You not need power regression for this, you only need slope and the log formula.
With respective rs and ro calculated from the Georgk Library you can measure all gases.
My formulas to calculate all datasheet gases are:
- CO2: ppm = 114.3544 * (rs/ro)^-2.93599
- CO ppm = 662.9382 * (rs/ro)^-4.0241
- Ethanol ppm = 75.3103 * (rs/ro)^-3.1456
- Ammonium NH4 ppm = 102.694 * (rs/ro)^-2.48818
- Toluene ppm = 43.7748 * (rs/ro)^-3.42936
- Acetone ppm = 33.1197 * (rs/ro)^-3.36587
| float CO2Curve[2] = {113.7105289, -3.019713765}; //MQ135 | float CO_secCurve[2] = {726.7809737, -4.040111669}; //MQ135 | float NH4Curve[2] = {84.07117895, -4.41107687}; //MQ135 | float C2H50H_Curve[2] = {74.77989144, 3.010328075}; //MQ135 | float CH3Curve[2] = {47.01770503, -3.281901967}; //MQ135 | float CH3_2COCurve[2] = {7.010800878, -2.122018939}; //MQ135 |
The next update of this post I will upload my library for MQ135 for obtain ppm for all gases and how to obtain more precission for this cheap sensor and a way to measure with 50m of distance using rf 433mhz module. Also my Android Bluetooth Arduino App to show all values ;)
There is a couple of screenshots:


obviously you need an arduino, mq135 sensor, bmp180, hc05 module and dht11 sensor to test it, but with time I will upload it.
The app source code and arduino is located in my github:https://github.com/zesteros/ArduinoAirQualityMonitor
And this is the resources where Im taking all info and knowledge
Arduino MQ135 Library George Krocker
https://github.com/GeorgK/MQ135
Davide Gironi MQ135 Post
Empierre Research MQ135 and others Sensors
Empierre Sketch Air Quality Multiple Gas Sensor Arduino
If you have questions please ask to me!
Hello, thank you for quote my MQ135 blog post.
ResponderEliminarYou have made a great job. I like your method to find out the function parameters.
WebPlotDigitizer is really a great tool for extraction the points, unluckly I doesn't know that tool at the time I write my post. I realized about WebPlotDigitizer a few times ago when a hackaday post write about this.
I still find the power regression method the simpler one. Anyway it's a matter of practice :)
thank you for take your time to respond and and for see my post, and the reason of why im not using power regression is because I dont know how to do it, but I really admire your capabilities to determine all mathematical job for this, finally, I have a question that I would like you answer it, and it is about the temperature and humidity, I calculated the equation of both functions on figure 2 in data sheet of this sensor, the first is the 33% humidity function:
Eliminar(rs/ro) = 1.5359 * 0.9896 ^ Temperature
and the second is for humidity an 85%
(rs/ro) = 1.3917 * 0.9895 ^ Temperature
My question is: how to apply this to correction of the sensor resistance reading? do you know something about?
I compared both functions with the data sheet functions and the 85% humidity function is the only what doesnt match so much
Thank you so much for spend time reading this. Regards
Can u please upload the arduino code as the library is changed or u can also post the library function
ResponderEliminarCourse, the library is located on my github https://github.com/zesteros/MQ135
Eliminarcan you explain it ?
EliminarscaleFactorNH4 * pow((getResistance()/r0NH4), -exponentNH4);
i get from your github, i hope u answer my question more fast. thanks
Answer my question ?
EliminarOf course, the constants scaleFactor, r0 and exponent are constants of nh4 calculated equation Ammonium NH4 ppm = 102.694 * (rs/ro)^-2.48818 where rs is the resistance read from arduino analogic input (mq135)
EliminarHello Angelo, i wonder how to know if an air quality is considered as "bad air", "normal", "good air", and "dangerous"? do you know the ppm range value?
ResponderEliminarThe level of normal ppm in air of gases, depends of your country laws. here in mexico, the co2 level is below of 400ppm.
EliminarHola Angelo,
EliminarI am trying to use your Arduino-sketch from github, but I get some errors.
The errors are:
Arduino: 1.8.5 (Windows 7), Board: "Arduino/Genuino Mega or Mega 2560, ATmega2560 (Mega 2560)"
C:\Users\JRGEN~1\AppData\Local\Temp\ccHcqWin.ltrans0.ltrans.o: In function `main':
C:\Program Files (x86)\Arduino\hardware\arduino\avr\cores\arduino/main.cpp:43: undefined reference to `setup'
C:\Program Files (x86)\Arduino\hardware\arduino\avr\cores\arduino/main.cpp:46: undefined reference to `loop'
collect2.exe: error: ld returned 1 exit status
Do you have any suggestions ?
I am using AnalogPin 0 für the sensor.
Saludos,
Jürgen
Este comentario ha sido eliminado por el autor.
EliminarHola Angelo, me again,
Eliminarcould it be, that I get the errors because I copy/pasted the file into the Arduino IDE and then uploaded it.
Do I have to change some values to do that ?
Muchas gracias por una respuesta
Jürgen
Yes, but for avoid Future problems I'm going to upload a simple example and the library That I used. Wait me until I upload it please.
Eliminarhttps://github.com/zesteros/ArduinoAirQualityMonitor/tree/master/Arduino/AirMonitor
Eliminarimport the .zip libraries in library folder with Arduino IDE "import from zip" option
hi i cant understand from where this is comming from x = 96.9691 * y^(-2.83688)
ResponderEliminarChange variables of the equation(pass x to left side) with a Math tool like wolfram. And you will get it.
EliminarOf this initial equation:
Eliminary = [2.3/10^(-0.3525)] * x ^ (-0.3525) = 5.0152 * x ^(-0.3525)
Este comentario ha sido eliminado por el autor.
ResponderEliminary = [2.3/10^(-0.3525)] * x ^ (-0.3525) = 5.0152 * x ^(-0.3525)
Eliminarwolfram is giving: y = [2.3/10^(-0.3525)] * x ^ (-0.3525) =5.17878/(x^0.3525)
You need to put:
Eliminarsolve y=5.0152 * x ^(-0.3525) for x
in aproximmate form
I cant get 5.0152 all calculations are showing y = 5.17878*x^(-0.3525)
ResponderEliminarbut not 5.0152 * x ^(-0.3525)
Sorry, so my calculus is wrong, but the co2 ppm read is approximate
Eliminarwould you please to explain how to get that value x = 96.9691 * y^(-2.83688) or ppm = 96.9691 * (rs/ro)^-2.83688 from y = [2.3/10^(-0.3525)] * x ^ (-0.3525) = 5.0152 * x ^(-0.3525) ?
ResponderEliminarHi, my process says that y= 5.0152 * x ^(-0.3525) if we change x and y for ppm and resistance, we found (rs/r0) =*5.0152 * ppm ^(-0.3525) and we need the ppm in the left side of equation, if you use wolfram you will obtain ppm(x in equation) in Mexico this process of change position of the variable in the equation is called clear.
EliminarSir, could you tell me where you get the normal amounts of concentration in the atmosphere from the different gases?
ResponderEliminarif I understand correctly, that data in the library is used in "ppm" parts per million
#define atmCO2 407.57
(approaching January 2018: 407.54 ppm (Recent Global CO2) from www.esrl.noaa.gov)
#define atmNH4 15
Now 15ppm in the atmosphere can not be, it is a mistake, the values in the atmosphere for the NH3 and many other gas is measured in "ppb" or parts per billion.
I can not find where to officially get that information and also consider it is a mistake in the library, which goes unnoticed because it is a very small value.
Could you clarify these points? Thank you
Of course, according the datasheet the Ammonium molecule is NH3 but the inaccuracy of the sensor does not give to us the opportunity to sense that gas, but it is noticeable, instead ppb NH3 I am using NH4 (with aproximate sensing) in ppm, but if I had a laboratory for put a known concentration of each gas and making tests constantly I would get the real values. The constant values that I am actually using is located in this academic articles:
Eliminarhttps://drive.google.com/open?id=1pVTG4mifNPiQuxEvFYsF6swJlc9p4nTD
how to calculate rs/ro?
ResponderEliminarplease help, asap
Hi Angelo. nice blog. Thank you for sharing us reading methods. My question is.. In real world can this sensor be used to measure ammonia alone if it goes above threshold level... ?
ResponderEliminarFor instance, if environment has high CO2 it should not alarm and does alarm only for ammonia...can it be programmed like that?
Thanks in advance..
Hi, how can I generate the apk? Thanks! Good work!
ResponderEliminarwow,i really like your blog,your blog give me a good information related to the Pocket Calculator.Thanks for this good one.......
ResponderEliminarhttps://www.cycalculator.com/
wow,i really like your blog,your blog give me a good information related to the Pocket Calculator.Thanks for this good one.......
ResponderEliminarDesktop Calculator Suppliers
Hello,
ResponderEliminarfloat MQ135::getResistance() {
int val = analogRead(_pin);
return ((1024./(float)val) * 5. - 1.)*RLOAD;
}
I didn't understand why you multiple with 5 the equation. I think it has to be ((1024./(float)val)-1)*RLOAD, and can you explain how you calculate CORA, CORB, CORC, CORD values?
its because need to be multiplied by 5v for analog/digital conversion
EliminarHi, I just want to ask if this sensor can use the 5V from the Arduino board and if the current output from the Arduino is enough for the MQ-135 sensor?
ResponderEliminarcan u tell me the value of Ro for CO MQ135?
ResponderEliminarHola Angelo. Muy bueno tu blog. He obtenido respuestas a varias preguntas que me han surgido. Una pregunta adicional. Que debo ajustar en el Sketch que tienes en Github si quiero que los datos me aparezcan por el minitor serial? ¿o en una lcd 16x2? Gracias!!!
ResponderEliminarclaro puedes usar la libreria LCD de Arduino e imprimir los datos directamente sin problema.
EliminarBorgata Hotel Casino & Spa - JTHub
ResponderEliminarBorgata Hotel 경산 출장샵 Casino 천안 출장마사지 & Spa in Atlantic City 제주도 출장안마 is 부산광역 출장안마 a 4-star 구미 출장샵 property located in Atlantic City with a 2.2 acre pool deck and 2 indoor pool areas. Borgata Hotel Casino